This Map Shows Where Climate Change Will Hit Us the Hardest

As global temperatures and sea levels rise due to climate change, the planet isn't changing in a uniform way. Some areas are more at risk for ecological collapse than others.
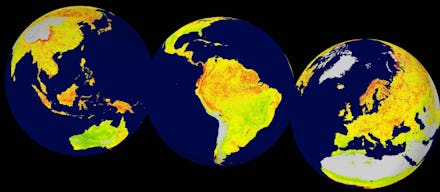
Now a team of researchers have created a map identifying the most vulnerable areas on the planet. They analyzed temperature (marked in red on the map below), rainfall (blue) and cloud cover (green) from 14 years' worth of global satellite data.
From the analysis of that data, the team figured out a brand new metric to measure changes in vegetation cover and rainfall.
They call it the "vegetation sensitivity index." It shows which areas of our planet are approaching a dangerous tipping point.
Areas with a high index, and therefore a high vulnerability to climate change, are shown in red on the map below. More resilient areas are shown in green. Yellow patches fall somewhere in the middle.
Read more: Polluted Air Could Be Making Us Obese
In case the map isn't clear enough, the researchers described the most vulnerable areas:
"We find ecologically sensitive regions with amplified responses to climate variability in the Arctic tundra, parts of the boreal forest belt, the tropical rainforest, alpine regions worldwide, steppe and prairie regions of central Asia and North and South America, the Caatinga deciduous forest in eastern South America and eastern areas of Australia," the researchers write in the study, which was published in the journal Nature.
The more satellite data we get, the more helpful this kind of analysis will be in identifying which areas of the planet we need to start earnestly protecting.
"Only through an understanding of vegetation's responses to current climate variability can we improve predictions of the future consequences of such variability on our planet's ecosystems and biodiversity, as well as on our own food security and welfare," Alfredo Huete, a professor of plant functional biology and climate change at the University of Technology Sydney, wrote in a letter describing the importance of the study.
h/t Ars Technica