Where Immigrants Go When They Come to America — In One Interactive Map

The immigration debate is once again taking center stage in Washington, as the House takes up the controversial bill passed by the Senate last year, and deliberates the issues of border security and a path to citizenship for illegal immigrants. It’s not clear if representatives will be able to reach a compromise, but if, miraculously, they do manage to enact legislation, the 113th Congress will redefine our country’s love-hate relationship with its newest residents.
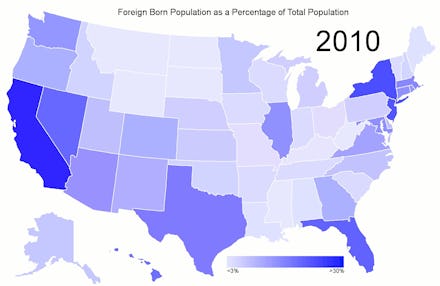
An animated map by Reddit user CushyJVftw, seen below, shows just how that relationship has changed over time. While President John Fitzgerald Kennedy famously described the United States as a nation of immigrants, the map makes it clear that, despite our rhetoric, our country hasn’t always welcomed citizens of the outside world with open arms.
Instead, it shows three distinct periods of immigration, in which the percent of foreign-born individuals in the United States ballooned, and shrank, and slowly began to grow again.
The first period, from 1850 through 1920, represents the mass migration from European countries like Germany, Ireland and Italy to the United States, as well as Asian immigration to the West prior to the Asian Exclusion Act of 1875 and the Chinese Exclusion Act of 1882. Despite the anti-Catholic, anti-German, and anti-Chinese nativism of the era, it’s the period of immigration that’s the most romanticized in our popular culture, from descriptions of a melting-pot Williamsburg in the novel a Tree Grows in Brooklyn to the murine ballads of of An American Tail.
That period came to a close in the early 1920s, when Congress enacted and codified quotas designed to limit the immigration of non-Northern Europeans, and, presumably, names with diacritic marks or an excess of vowels. As a result, immigration dropped off throughout the mid-20th century, which can be seen in the blanching of states across the animation. In fact, when Kennedy published A Nation of Immigrants in 1958, the proportion of foreign-born residents was near its nadir. It wouldn’t increase significantly until 1965, when Kennedy’s younger brother championed the Immigration and Nationality Act in Congress, ending the quota system and enacting visas designed to attract scientists, engineers, and other skilled laborers.
While the 1965 law didn’t open the United States to the mass migrations of the early 20th century, it did open the country to immigration from Asia, Africa, and South America in a way that it hadn’t been before, fundamentally changing the demographic makeup of the United States. The proportion of foreign-born citizens once again began to grow, as did the ethnic diversity of the United States, leaving us to decide whether America really is the land of opportunity that it’s billed itself as being.
If the current legislation makes its way through Congress and to the president’s desk, the map is likely to change again. After all, we’ve come to depend on immigrant labor at all levels of our economy, from tilling our fields to the treating the ill. While we may not be able to agree about how to rectify the situation, it’s clear that our current legislation cannot adequately cope with the status quo. Hopefully, we’ll be able to have an honest conversation about how best we can serve our country’s needs, and all of the people living in it.