Interactive Maps Show You America's Drug of Choice— And It's Not What You Think

Can you name America's drug of choice? It's not marijuana, cocaine or heroin — it's alcohol. Just take a look at the maps below.
According to a report from the Centers for Disease Control and Protection (CDC), alcohol has taken 2.5 million potential life years because of binge-drinking between the years 2006 and 2010 alone. Alcohol kills more than AIDS, tuberculosis and violence combined, and accounts for more than 1 out of every 20 global deaths.
We hear statistics on America’s increasing consumption of drugs, but it’s hard to get a visual sense of what that looks like.
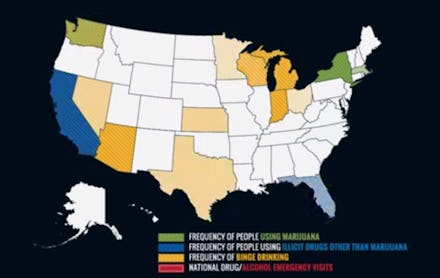
These animated graphs simulate the real-time use of cannabis, alcohol, and other substances. Each time the state flashes, someone is "using" a substance. The final graphic consolidates all the substance use in the country onto a single map, displaying our alarming propensity towards altered states. Rehabs.com created the maps using data from 2010-2011 National Survey on Drug Use and Health (NSDUH).
Marijuana
In the graphic, California is blinking about once a second, being the nation’s most populous state and the one with the longest running medical marijuana program. Despite having relatively strict marijuana laws, Texas, the nation’s second most populous state, flashes about once every 2.5 seconds. A 2013 update on the NSDUH found that cannabis use nationwide had increased to 7.3% nationwide, up from 7% in 2010-2011.
Illicit drugs
This graphic includes cocaine, heroin, hallucinogens, inhalants, and prescription drug misuse. Again, the most populous states and those that serve as entry points for illegally trafficked drugs — California and Texas — flash the most frequently. The frequent flashes all over the country account for heroin and prescription drug addiction spiking around the country, and ecstasy experiencing a resurgence among youth culture. Methamphetamine is not included above. According to the NSDUH, meth use declined by two-thirds between 2006 and 2010. However, a 2011 UCLA study disputes that, claiming that it was now back on the rise.
Alcohol
Now we can see America’s real drug of choice. This map shows instances of binge drinking across the country, and it is a veritable Christmas tree of drunkenness. In this context, binge drinking is defined as having at least five drinks in one sitting, enough to make the average person legally drunk. Clearly, the only truly legal poison on the list is the one consumed with the most abandon. While binge drinking has reportedly remained steady for decades among college students, 2014 study from the Centers for Disease Control and Prevention found that drinking major public health problem in the U.S. at large, with one in every 10 working age person dying from too much drinking. And this isn’t just an American problem. It’s an even larger issue worldwide. The World Health Organization reported that 3.3 million people in the world die from drinking every year, about one person every 10 seconds.
All Substances
Now the whole party comes into view. This graphic shows us exactly how much Americans are wilding out with weed, booze, and various other illicit drugs. It all looks like a raucous good time until you hit the 12 second mark and see an ambulance flash on the screen. For this final map, Rehabs.com shows us the toll that drug use takes on pubic health and safety, with one drug-related emergency room visit occurring every 12 seconds.
While these maps extrapolate on one set of data, and don’t account for the actual incidences of drug use occurring around the country, they give us a visual reference for our comparative use of a number of substances, and in almost every case, use has increased since this data was collected.