Hate Crime Maps Reveal the Most Prejudiced Places in America

Hate crimes are still far too common in the United states today.
Just look at a couple of recent incidents. Earlier this month, a man in Los Angeles assaulted a Muslim woman and tore off her hijab. Last week, someone in Miami Beach vandalized a Jewish family’s car, writing the word “Hamas” across the back window.
These stories aren’t exceptions. At least 6,593 hate crimes occurred in 2012, according to hate crime data compiled by the University of Michigan.
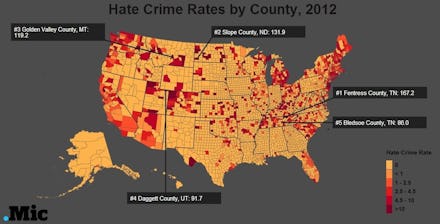
The map below reveals where hate crimes frequently occur. Each county is colored based on its hate crime rate, the number of hate crimes per 100,000 residents in 2012.
A key caveat is that local law enforcement agencies are not required to report hate crimes. The data presented here covers 91% of the U.S. population, and unreported hate crimes likely explain the apparent gap in the Deep South.
The FBI defines a hate crime as a crime motivated by bias against a race, religion, disability, ethnic origin or sexual orientation.
Hate crime rates are annual and calculated per 100,000 people. Source: Uniform Crime Reporting Program Data: Hate Crime Data, 2012. Local law enforcement agencies reporting hate crime data cover 91% of the U.S. population. Local law enforcement agencies are not required to report data. County population data from U.S. Census.
Correction: August 12, 2014
An earlier version of this article stated that the 2012 hate crime rate in Boise County, Idaho was 263.4, the highest in the country. In fact, the hate crime rate in Boise County, Idaho was 0 in 2012.